


Brooklyn leads by count. The Bronx leads by rate.
Pedestrians account for a modest share of the people injured in New York City traffic crashes and a far larger share of the people killed in them. Across the five boroughs, pedestrians die at a much higher rate relative to injuries than motorists or cyclists do. Getting struck on foot is simply less survivable than being inside a vehicle during a collision.
That asymmetry is the reason borough rankings need to be read carefully. A borough can rank low for total injuries and high for pedestrian deaths, and those two facts describe different problems for different people.
This analysis ranks the five boroughs two ways. First by raw casualty counts from 2020 through 2025. Then by casualties per 100,000 residents. The two rankings disagree with each other, and the disagreement is the most useful thing in the data. Brooklyn leads by count. The Bronx leads by rate. Both statements are true and they answer different questions.
Source: NYC Open Data, dataset h9gi-nx95
Why pedestrians dominate the death figures
Injuries are spread across all road users
Injuries in this dataset are spread across all road users. Deaths concentrate among people outside of vehicles.
A pedestrian has no protection
A driver in a collision has a structure, restraints, and crumple zones absorbing energy. A pedestrian has none of that.
Injury and death rankings don’t line up
The crash records report outcomes rather than mechanisms, so this analysis reports the pattern and does not attempt to model it. The practical consequence for borough comparisons is that injury rankings and death rankings will not line up, and neither should be treated as a proxy for the other.
Borough rankings by raw count, 2020–2025
Brooklyn tops five of the six categories tracked here
Brooklyn leads the city in total persons injured, pedestrians injured, motorists injured, cyclists injured, and pedestrians killed. It tops five of the six categories tracked here.
Queens leads in total persons killed. That is the one raw-count category Brooklyn does not lead.
Traffic injuries and fatalities by borough
Persons injured and persons killed, 2020–2025.
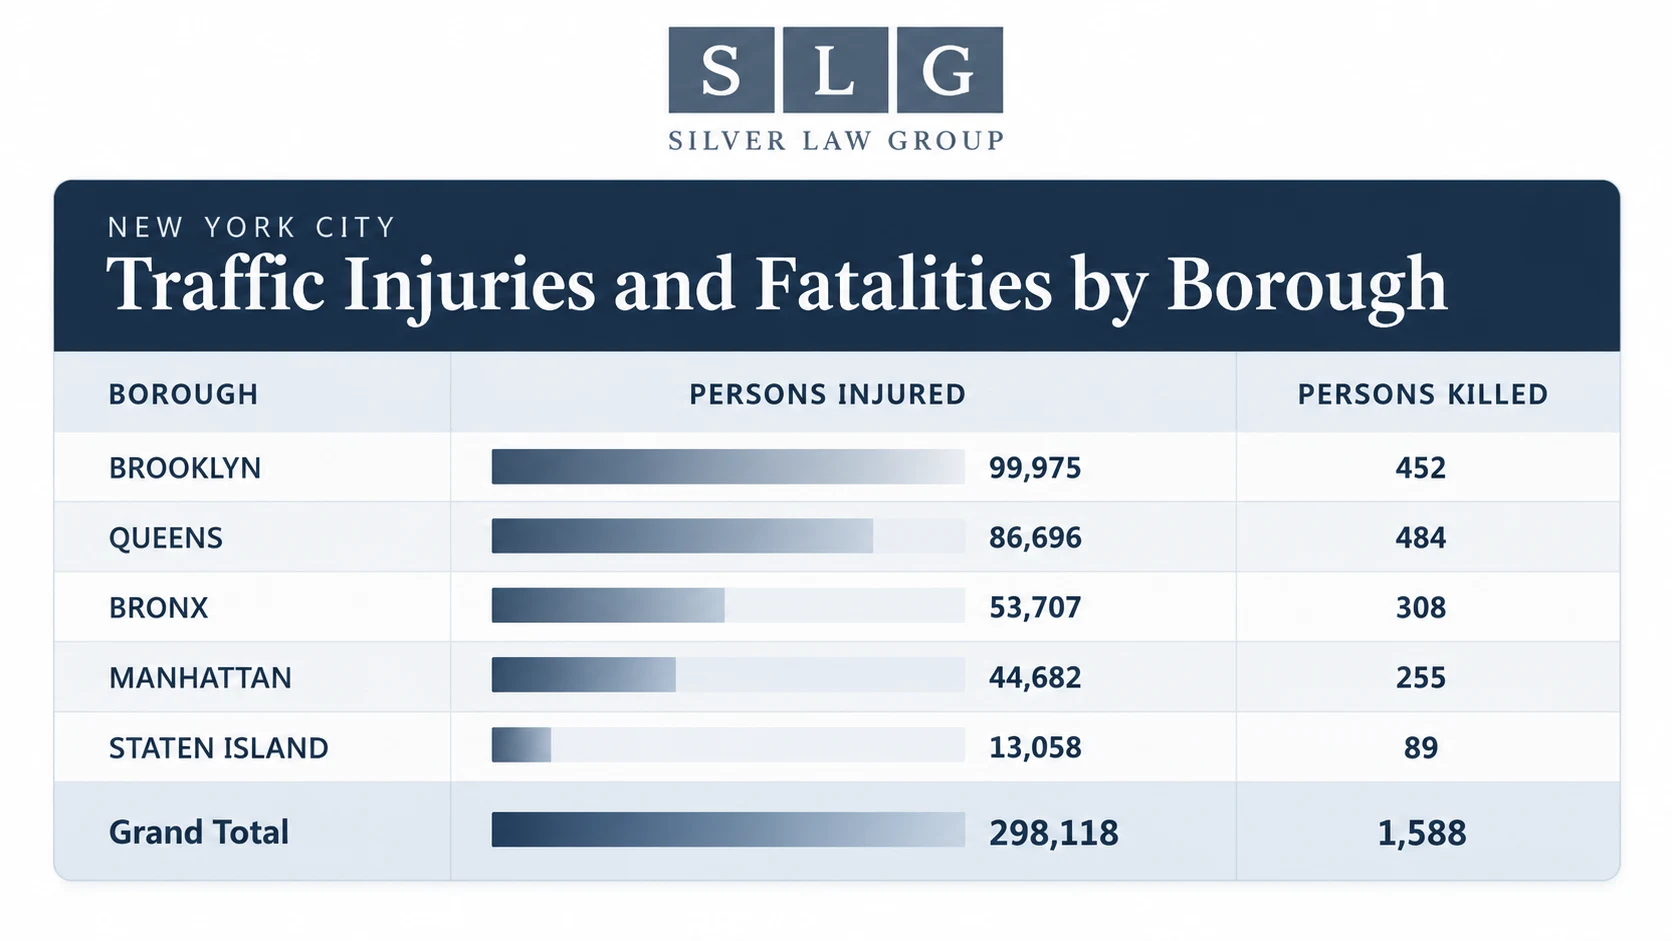
Apply the obvious correction
Before reading anything into those results, apply the obvious correction. Raw counts track borough population and traffic volume. Brooklyn is the most populous borough, and more residents produce more trips, more vehicles, and more crashes. A large share of Brooklyn’s lead is a function of its size rather than a statement about how its streets are designed or driven.
Which borough ranks first, by raw count
| Category | Borough ranked 1st |
|---|---|
| Total persons injured | Brooklyn |
| Pedestrians injured | Brooklyn |
| Motorists injured | Brooklyn |
| Cyclists injured | Brooklyn |
| Pedestrians killed | Brooklyn |
| Total persons killed | Queens |
Borough totals also hide where the harm actually sits. A borough-level figure aggregates every road inside it, from limited-access parkways to neighborhood shopping streets, and those produce very different kinds of casualties. Our street-level analysis of the same crash data ranks individual corridors such as the Belt Parkway and Atlantic Avenue, which is a better tool for understanding any specific route.
Manhattan ranks differently depending on who is counted
Manhattan ranks 4th among the five boroughs in total persons injured. It ranks 3rd in pedestrians injured, 2nd in cyclists injured, and 2nd in cyclists killed.
The pattern is consistent. Manhattan sits low on the measure dominated by vehicle occupants and climbs on every measure involving people outside vehicles. That fits a borough with dense foot traffic, heavy cycling, and slower vehicle speeds than the outer boroughs.
of 5 boroughs
Total persons injured
of 5 boroughs
Pedestrians injured
of 5 boroughs
Cyclists injured
of 5 boroughs
Cyclists killed
A permanent caveat on cyclists
The cyclist rankings need one caveat attached to them permanently. Manhattan has a large amount of cycling, and the crash dataset does not measure cycling volume. A borough with more riders will record more rider injuries even if each individual trip is no more dangerous than it would be elsewhere. Nothing here supports a claim that Manhattan is more dangerous per ride.
Rankings per 100,000 residents
Adjusting for population changes the leaderboard
The Bronx
Injured, pedestrians injured, motorists injured, pedestrians killed
The Bronx ranks 1st per 100,000 residents in persons injured, pedestrians injured, motorists injured, and pedestrians killed. On a rate basis it is the borough where residents are most exposed to traffic harm.
Queens
Total deaths and motorists killed
Queens ranks 1st per capita in total deaths and in motorists killed. Queens also led total deaths by raw count, which makes it the one borough where both methods agree. When a borough tops a category by count and by rate at the same time, population size is not carrying the result.
Manhattan
Cyclists injured
Manhattan ranks 1st per capita in cyclists injured.
Which borough ranks first, per 100,000 residents
2020 crash records against 2020 decennial population.
| Category | Borough ranked 1st per capita |
|---|---|
| Persons injured | The Bronx |
| Pedestrians injured | The Bronx |
| Motorists injured | The Bronx |
| Pedestrians killed | The Bronx |
| Total deaths | Queens |
| Motorists killed | Queens |
| Cyclists injured | Manhattan |
Three limits apply to every figure in this section
The per-capita figures cover 2020 only
They pair 2020 crash records with 2020 decennial population counts. The decennial count is used because it is the most recent population figure that was actually counted rather than projected. The tradeoff is that the entire per-capita section rests on a single pandemic year with abnormally low traffic volumes. These rates should not be read as current-year rates, and they should not be compared directly against the 2020–2025 raw counts above.
Resident population is a weak denominator for Manhattan
Manhattan absorbs a very large daily commuter and visitor population that raises exposure on its streets without appearing anywhere in its resident count. Dividing Manhattan’s crashes by its residents therefore overstates its per-capita rates relative to boroughs whose daytime population is closer to their residential population. This applies to Manhattan’s 1st-place cyclist ranking as much as to any other Manhattan figure.
Cycling volume is still unmeasured
The caveat from the raw counts carries over. Manhattan’s per-capita cyclist ranking reflects riders injured per resident, which is not the same as risk per trip or per mile ridden.
Count and rate tell different stories
Putting the two rankings beside each other is the clearest way to see what each one measures. Brooklyn leads the raw counts. The Bronx leads the rates. Queens leads deaths under both methods.
Neither ranking is more correct. They answer different questions.
Brooklyn
Raw counts tell you where the largest number of people are being hurt, which is the right frame for allocating citywide resources such as emergency response, enforcement, and capital spending.
The Bronx
Per-capita rates tell you how much risk an individual resident is exposed to, which is the right frame for asking whether a borough is being served fairly.
The Bronx moving to the top on a rate basis while Brooklyn leads the counts is the central finding of this analysis. A resident of the Bronx encountered more traffic harm per person than a resident of any other borough in 2020, even though the Bronx does not lead any raw category. Reporting that only uses raw totals misses this entirely.
The comparison below crosses two different time frames, so treat it as a comparison of ranking methods rather than a like-for-like measurement.
Who leads, by method
| Category | Leads by raw count, 2020–2025 | Leads per 100,000 residents, 2020 |
|---|---|---|
| Persons injured | Brooklyn | The Bronx |
| Pedestrians injured | Brooklyn | The Bronx |
| Motorists injured | Brooklyn | The Bronx |
| Pedestrians killed | Brooklyn | The Bronx |
| Cyclists injured | Brooklyn | Manhattan |
| Total deaths | Queens | Queens |
The two columns cover different periods. Raw counts run 2020–2025. Per-capita rates use 2020 crash data against 2020 decennial population.
What crash reports list as contributing factors
The factors police record at the scene split cleanly by outcome. Inattention dominates injuries. Speed dominates deaths.
For persons injured, the leading recorded factors are Driver Inattention/Distraction, Failure to Yield Right-of-Way, and Following Too Closely. For persons killed, the leading factors are Unsafe Speed and Driver Inattention/Distraction. Driver Inattention/Distraction leads for cyclists injured and for motorists injured. Unsafe Speed leads for motorists killed.
Read across those rows and the pattern is that inattention produces a large volume of collisions while speed determines how many of them are fatal. Unsafe Speed appears in the fatal categories and does not appear in the injury categories.
Leading recorded factors by outcome
| Outcome | Leading recorded factors |
|---|---|
| Persons injured | Driver Inattention/Distraction; Failure to Yield Right-of-Way; Following Too Closely |
| Persons killed | Unsafe Speed; Driver Inattention/Distraction |
| Cyclists injured | Driver Inattention/Distraction |
| Motorists injured | Driver Inattention/Distraction |
| Motorists killed | Unsafe Speed |
Footnote on excluded values
“Unspecified” is the single most frequently logged contributing factor for persons killed, appearing on 485 records, and for pedestrians killed, appearing on 313 records. It is excluded from the ranked lists above because it records the absence of a determination rather than a cause. Leaving it in would put a blank field at the top of every fatal category and tell readers nothing. The size of that gap should temper how much weight the ranked factors carry, since the most common entry in the fatal-crash data is a missing answer.
Methodology and limitations
Sources
Crash figures come from NYC Open Data, Motor Vehicle Collisions (Crashes), dataset h9gi-nx95. Population figures come from the NYC Department of City Planning report NYC Population Projections 2035–2055, using the 2020 decennial counts it reports rather than any projected figure.
Borough inference, and why every ranking here is an estimate
This is the limitation that matters most, and readers should weigh it before citing any borough figure. Borough was missing from 31% of records in the 2020–2025 set and from 35% of records in the 2020-only set used for the per-capita rankings.
Records with no borough cannot be assigned to a borough ranking. Discarding roughly a third of all crashes was not a workable option either, since missing fields are unlikely to be spread evenly across the city and deletion would have biased the results toward areas with more complete reporting.
Borough was therefore inferred from the LATITUDE, LONGITUDE, LOCATION, ON STREET NAME, CROSS STREET NAME, and OFF STREET NAME fields using an AI-assisted geographic matching process. That reduced records with no borough from 31% to 3% in the 2020–2025 set and from 35% to 3.5% in the 2020-only set. Records that still could not be resolved are excluded.
Every borough figure in this article depends on that imputation. The rankings are estimates. A different matching method, or a stricter one, could shift them. Categories where two boroughs sit close together are the most likely to move. Anyone reproducing this work using only the borough field as published by the city should expect different totals.
Two different time frames
Raw counts cover 2020 through 2025. Per-capita rates cover 2020 only, because that is the year matching the most recent counted population. The two sections are not directly comparable and the article does not treat them as such.
Pandemic baseline
The per-capita section rests entirely on 2020, a year of abnormally low traffic volume. These are not current-year rates.
Resident population as a denominator
Per-capita rates divide crashes by residents. They do not account for commuters, visitors, or through traffic. This understates exposure most severely in Manhattan.
Unmeasured exposure
The dataset contains no traffic volume, no pedestrian counts, and no cycling volume. Nothing here supports per-trip or per-mile risk comparisons between boroughs.
Reported crashes only
The dataset covers police-reported collisions. Crashes that were never reported do not appear in it.
If you were injured in a crash
Motor vehicle accidentsPeople hurt in a New York City traffic crash often have questions about insurance claims, medical bills, and what their options are. Those questions are worth raising with an attorney who handles motor vehicle cases. Silver Law Group is available to talk through what happened.This article is informational and is not legal advice.