

The deadliest road in New York City is one almost nobody walks on.
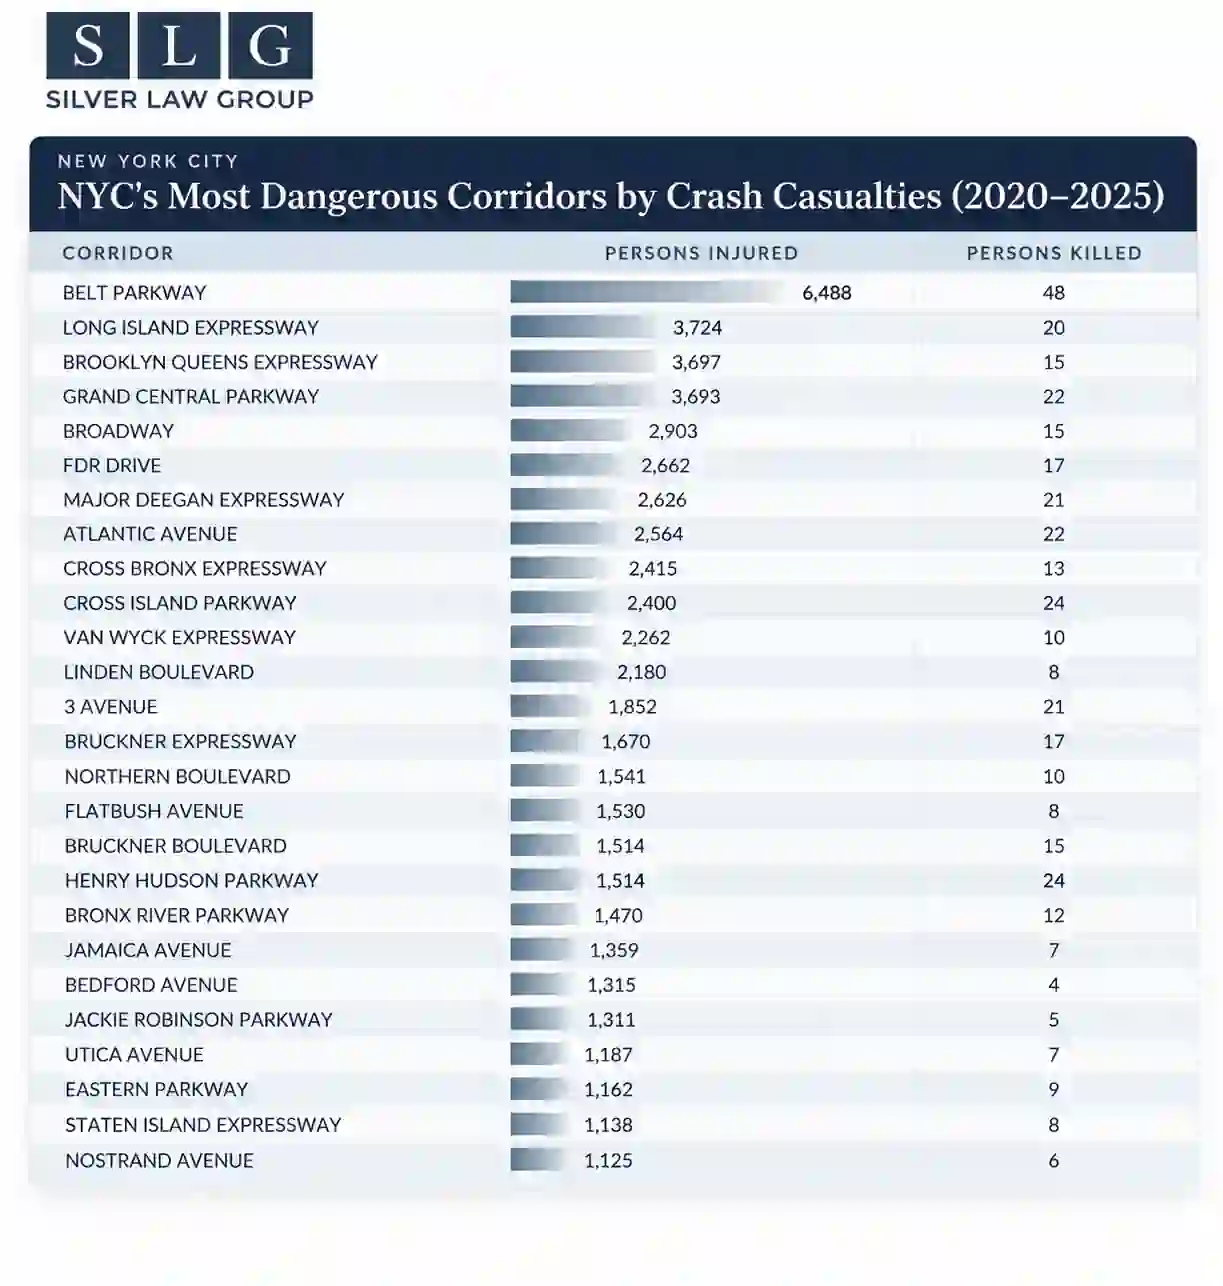
One road accounts for more traffic casualties than any other in New York City, and almost nobody walks on it. Between 2020 and 2025, the Belt Parkway recorded 6,488 people injured and 48 people killed. Of the injured, 6,458 were motorists.
That gap between where crashes happen and where people walk is why most “deadliest streets” lists mislead. A highway and a shopping street can sit next to each other in the same ranking while describing completely different problems.
This analysis uses the City of New York’s Motor Vehicle Collisions (Crashes) dataset from NYC Open Data, covering crash records from 2020 through 2025 across all five New York City boroughs. The statistics and rankings presented below are based on the resulting dataset after this processing. The underlying crash records come from NYC Open Data.
Source: NYC Open Data, dataset h9gi-nx95
What these rankings can and cannot tell you
Raw totals reflect exposure
Start with what the counts actually measure. The Belt Parkway, the Grand Central Parkway, and Broadway are long, high-volume corridors. Roads that carry more vehicles across more miles collect more crashes even when conditions on any given block are unremarkable. Raw totals reflect exposure as much as danger.
No per-mile or per-vehicle rates
The dataset does not carry traffic volume or corridor length in a form that supports per-mile or per-vehicle normalization, so none is attempted here. These rankings show where casualties concentrate. They do not establish which street is riskiest per trip or per mile traveled.
Street names are free text
A second limitation shapes everything below. Street names in the crash data are recorded as free text, and long corridors such as Broadway and 3rd Avenue run through more than one borough. All records sharing a street name are aggregated under that name in this analysis.
48 dead on one parkway — twice the toll of any other road in the city
The corridors with the most deaths
The Belt Parkway leads the city with 48 people killed from 2020 through 2025 — twice the toll of any other corridor. Behind it, the Cross Island Parkway and the Henry Hudson Parkway are tied at 24 deaths each, and the Grand Central Parkway and Atlantic Avenue follow, tied at 22.
The four deadliest corridors are all limited-access parkways. Atlantic Avenue is the entry that deserves attention: at 22 deaths it is the deadliest conventional street in New York City, the only surface street near the top of the ranking. Unlike the parkways around it, Atlantic Avenue is lined with intersections, crosswalks, bus stops, and businesses, and people cross it on foot every day.
Persons killed by corridor, 2020–2025
- Limited-access parkway
- Surface street
- Belt ParkwayLimited-access parkway481st
- Cross Island ParkwayLimited-access parkway24Tied 2nd
- Henry Hudson ParkwayLimited-access parkway24Tied 2nd
- Grand Central ParkwayLimited-access parkway22Tied 3rd
- Atlantic AvenueSurface street22Tied 3rd
Ranks are citywide positions among named corridors, counting every stretch of road that carries the name regardless of borough. Atlantic Avenue is the highest-ranked surface street; the four corridors at or above its death count are all limited-access parkways.
The 26 corridors with the most casualties
Persons injured, with persons killed alongside, 2020–2025.
What the Belt Parkway numbers actually measure
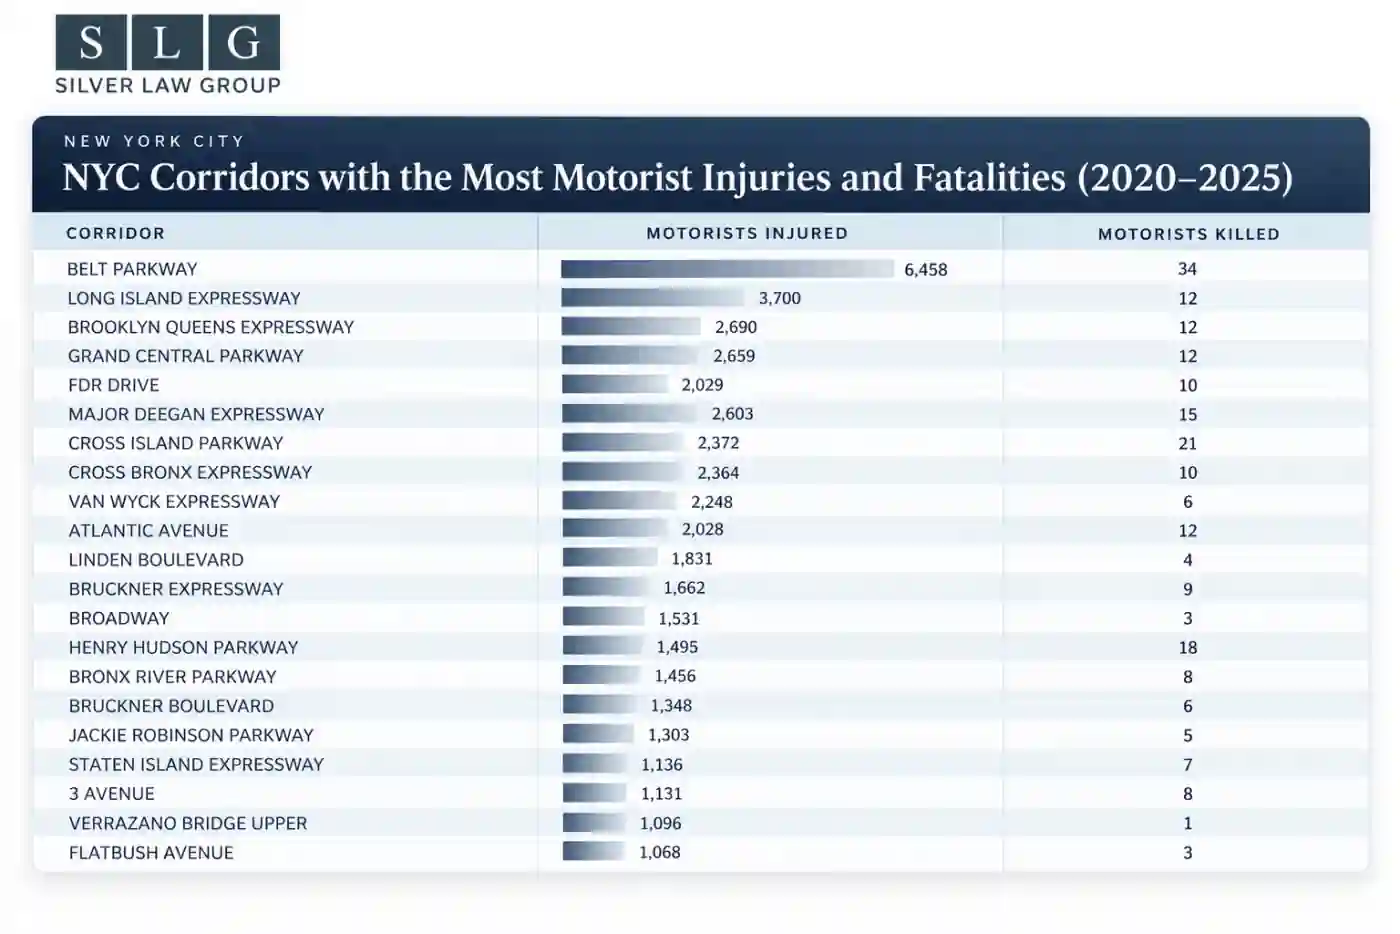
The Belt Parkway ranks first citywide for motorists injured and for motorists killed. It recorded 6,458 motorists injured and 34 motorists killed, the highest totals in the city on both measures.
It is a limited-access highway. There are no crosswalks along it, no bike lanes, no storefronts, and no ordinary reason for anyone to be on foot. Pedestrian exposure is close to zero, which is why the pedestrian figures are both small and severe. The Belt Parkway recorded 19 pedestrians struck and 12 killed across six years.
That pattern is a highway phenomenon. Vehicles travel at highway speeds, and a person struck at those speeds rarely survives. It tells you very little about the risk of walking on an ordinary New York street.
All persons
- Injured
- 6,488
- Killed
- 48
Motorists
- Injured
- 6,458
- Killed
- 34
Pedestrians
- Struck
- 19
- Killed
- 12
The Grand Central Parkway belongs in the same category. When these two corridors appear at the top of a citywide ranking, they are describing high-speed motor vehicle crashes on roads built to keep pedestrians out. Surface streets that sit lower on a death ranking can still be far more dangerous places to walk, which is what the pedestrian figures show.
The practical consequence is that any single citywide ranking mixes two separate safety problems. One is crash severity on limited-access highways, concentrated almost entirely among drivers and passengers travelling at speed. The other is the risk of being struck while walking or cycling on a street designed for mixed use. The countermeasures for the two have very little in common. This analysis reports both and keeps them apart.
The streets that matter most to pedestrians and cyclists
Once parkways are set aside, a different set of corridors comes forward. These are streets people walk along, cross, shop on, and cycle down. The casualties recorded on them involve people outside of vehicles, and the exposure producing those casualties is not optional. Nobody chooses to walk on the Belt Parkway. Crossing Atlantic Avenue or 3rd Avenue is part of ordinary daily life for the people who live and work around them.
Broadway
1st citywide for both
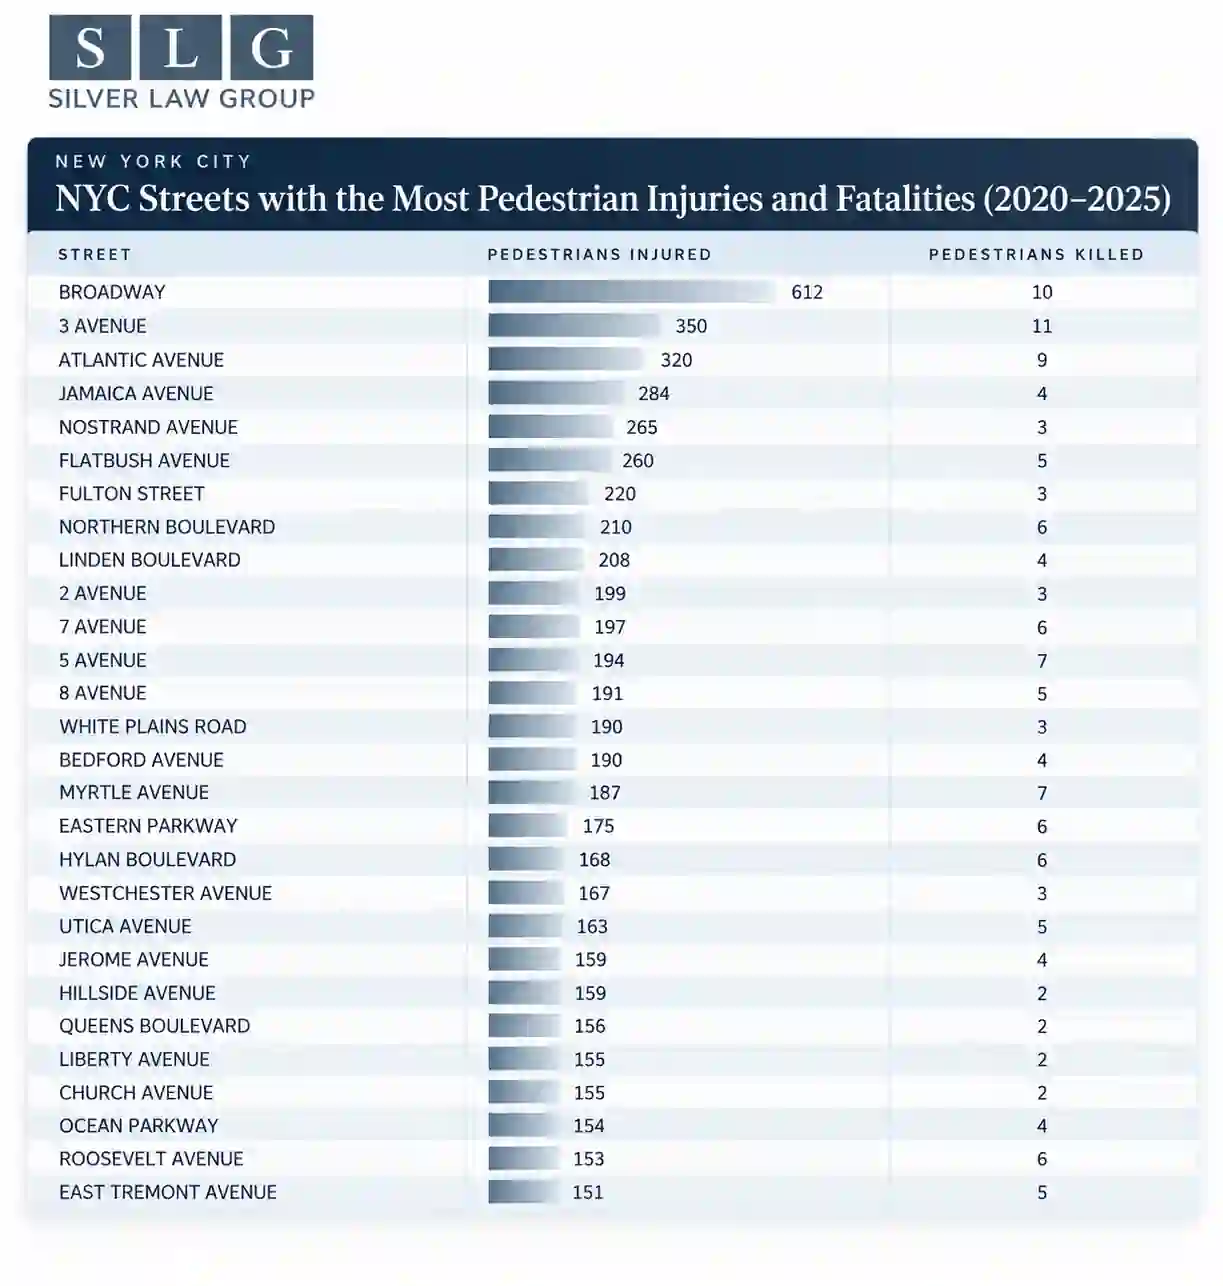
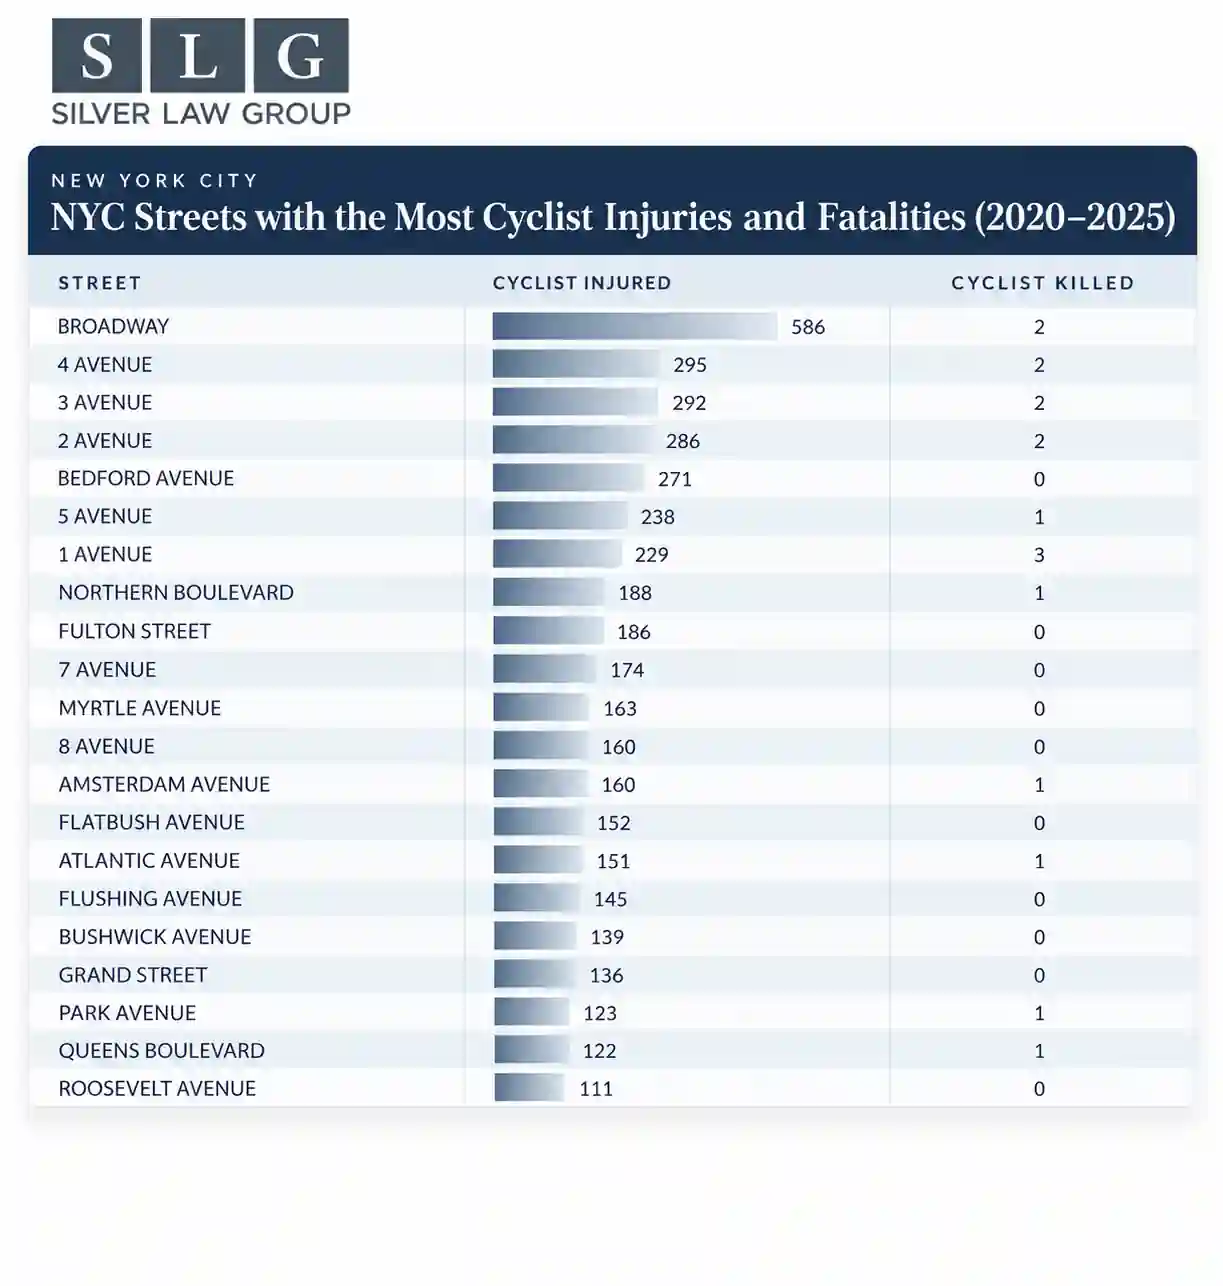
Broadway ranks first citywide for pedestrian injuries and first citywide for cyclist injuries. It recorded 612 pedestrians injured and 586 cyclists injured from 2020 through 2025. Broadway is also one of the longest corridors in the city, and the name appears in more than one borough, so its totals reflect an unusually large amount of exposure. High volume does not erase the finding. It does mean Broadway should be read as a corridor-wide total rather than a claim about any single stretch.
3rd Avenue
Highest toll of any surface street
3rd Avenue recorded 11 pedestrians killed and 350 pedestrians injured, the highest pedestrian death toll of any surface street in the city. This is the number that matters most for anyone assessing risk on foot. These deaths happened on a street with signals, crosswalks, and sidewalks, in places where walking is the expected behavior.
Atlantic Avenue
Deadliest conventional street
Atlantic Avenue’s 22 deaths make it the deadliest conventional street in New York City, tied for third overall with the Grand Central Parkway. A surface street reaching parkway-level death counts is the clearest signal in this dataset.
Borough context matters for all three, since streets carrying the same name behave differently depending on where they run. Our borough-level analysis of the same crash data breaks these patterns down by borough.
Three streets compared
| Street | Pedestrians injured | Pedestrians killed | Cyclists injured | Notable |
|---|---|---|---|---|
| Broadway | 612 | 10 | 586 | 1st citywide for pedestrian and cyclist injuries |
| 3rd Avenue | 350 | 11 | 293 | Highest pedestrian death toll of any surface street |
| Atlantic Avenue | 320 | 9 | 151 | 22 total people killed; deadliest surface street by total fatalities |
Top streets by road user
When crashes happen
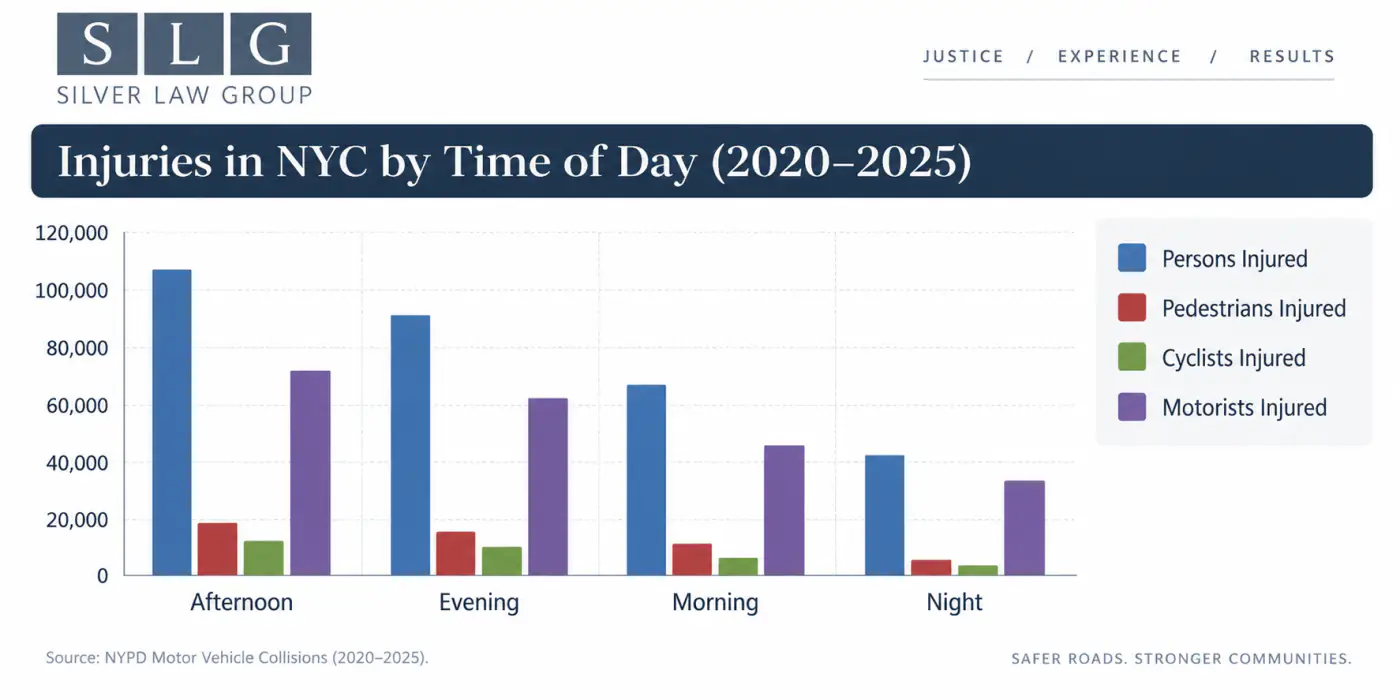
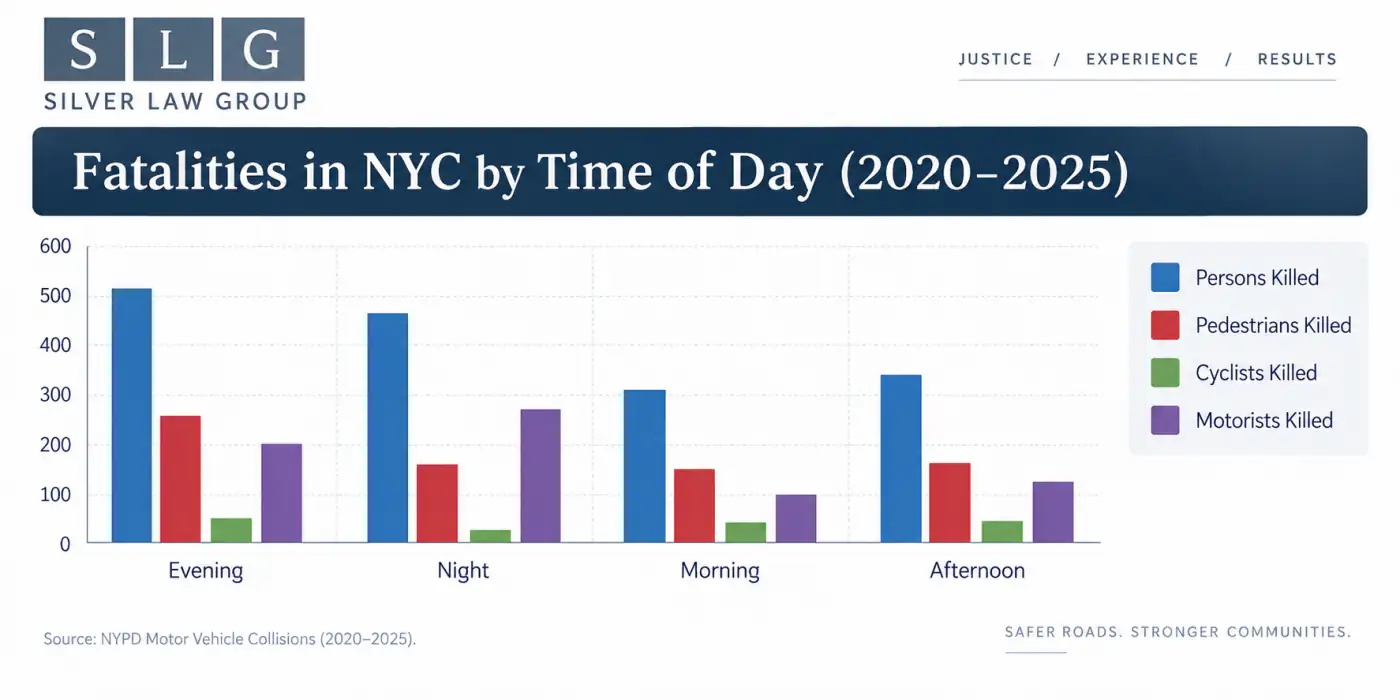
Injuries peak during daytime hours. Deaths peak in the evening.
The two patterns pull in opposite directions. More people and more vehicles are on the road during the day, which produces more collisions and more injuries in total. Evening traffic is lighter and moves faster, and the crashes that do happen are more likely to be fatal. The dataset supports the pattern itself. It does not support the explanation, so treat the reasoning as a reasonable hypothesis rather than a finding.
00:00–05:59
Lower injury volume
06:00–11:59
Part of the daytime injury peak
12:00–17:59
Part of the daytime injury peak
18:00–23:59
Deaths peak
Pedestrian injuries didn’t just recover after 2020. They kept climbing
Year by year, 2020–2025
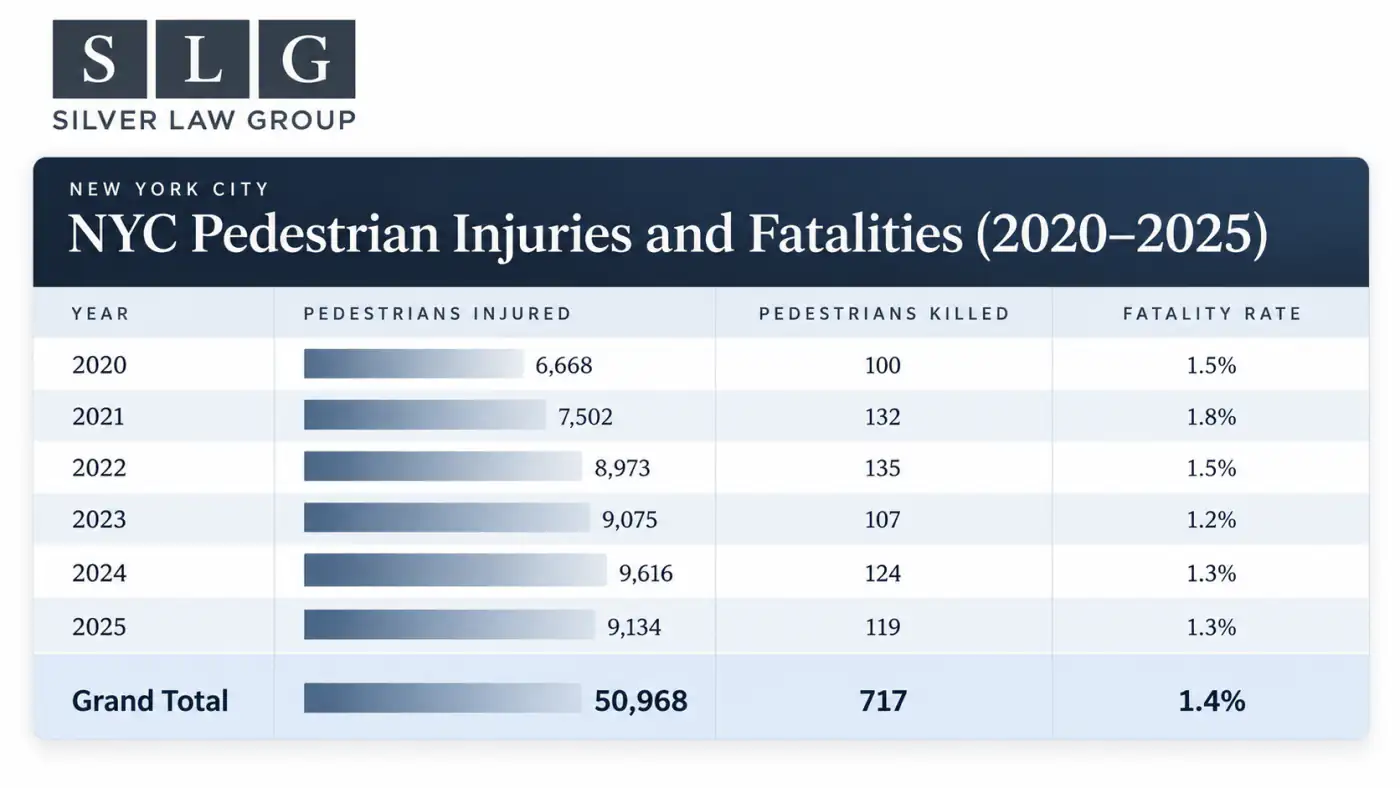
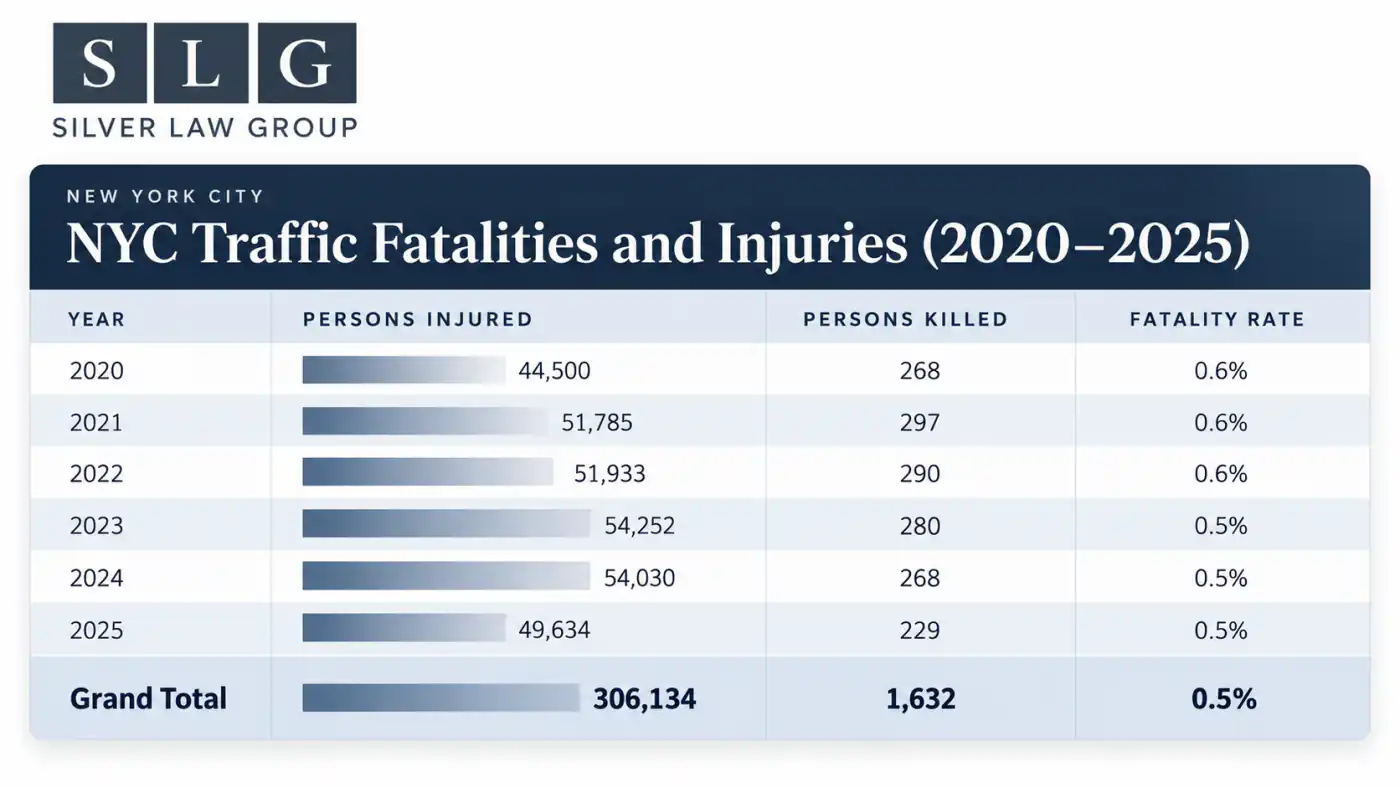
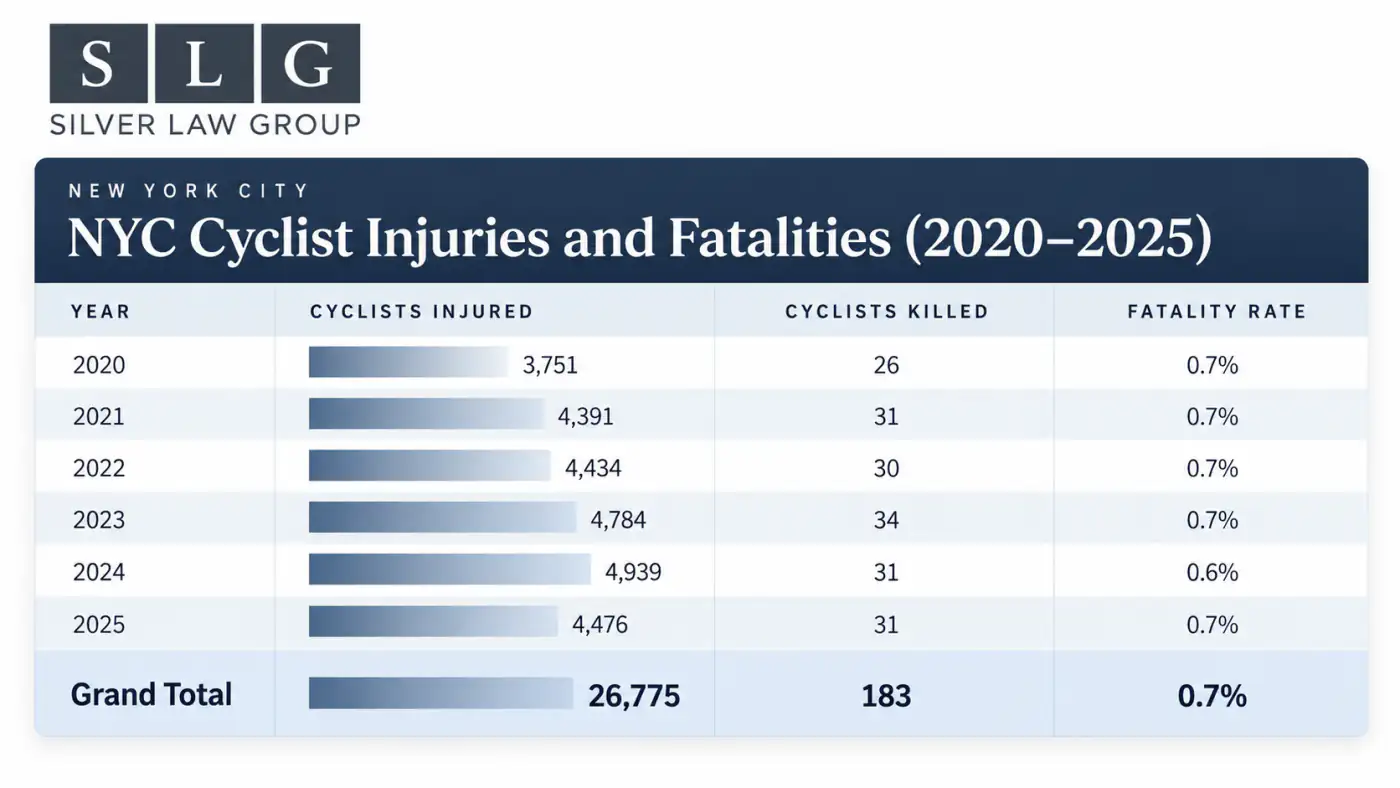
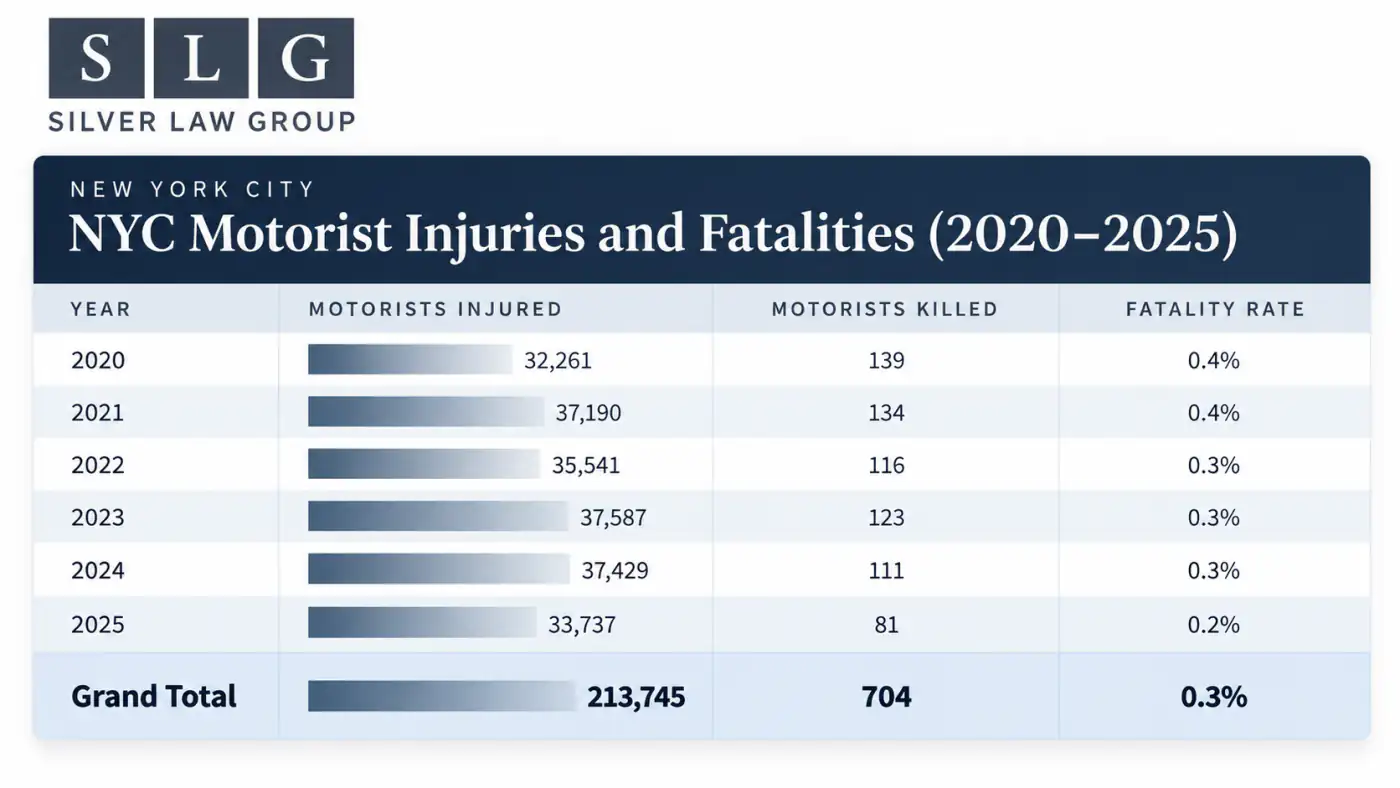
Pedestrian injuries have risen sharply since 2020. The trend is present in the data, and it needs one large qualification attached to it.
One large qualification
2020 was a pandemic year. Traffic volumes were abnormally low for extended periods, which makes it a distorted starting point for any comparison. An increase measured from a 2020 baseline captures the city’s return to normal traffic conditions as well as any genuine deterioration in street safety. Some of the rise is recovery. This dataset alone cannot separate how much is recovery and how much is a real worsening of conditions for people on foot.
The direction of the trend still matters, and it lines up with the surface-street findings above, where the corridors carrying the heaviest foot traffic also carry the highest pedestrian casualty counts. Establishing a genuine increase in risk rather than a return to prior conditions would require exposure data the crash records do not contain, such as how many people are walking each corridor and how often.
Methodology and limitations
Source
All figures come from NYC Open Data, Motor Vehicle Collisions (Crashes), dataset h9gi-nx95. The scope is calendar years 2020 through 2025, five boroughs only.
Borough inference
This is the most significant methodological choice in the analysis and readers should weigh it before using the figures. In the 2020–2025 extract, 31% of crash records had no value in the borough field. Because the analysis is restricted to the five boroughs, those records could not be assigned without further work. Discarding them would have meant dropping nearly a third of all crashes, and missing fields are unlikely to be distributed evenly across the city, so simple deletion risked skewing the results toward areas with more complete reporting.
Borough was therefore inferred from the LATITUDE, LONGITUDE, LOCATION, ON STREET NAME, CROSS STREET NAME, and OFF STREET NAME fields using an AI-assisted geographic matching process. That step reduced records with no borough from 31% to 3%. The remaining 3% could not be resolved and are excluded from all figures in this analysis.
Inferred borough values are not city-assigned values. Anyone reproducing this work using only the borough field as published should expect different totals.
Street names are free text
The dataset records street names as typed text rather than as identifiers from a controlled list. Corridors such as Broadway and 3rd Avenue span multiple boroughs and are aggregated here under a single name. Totals for those corridors therefore describe every stretch of road carrying that name, not one continuous roadway.
No normalization
Casualty counts are not adjusted for corridor length, traffic volume, or pedestrian volume. Long, busy corridors accumulate more crashes for reasons that have nothing to do with design quality. The rankings identify where harm concentrates in absolute terms.
Reported crashes only
The dataset covers police-reported collisions. Crashes that were never reported do not appear in it.
Baseline effects
Any trend anchored to 2020 is affected by pandemic traffic conditions, as described above.
If you were injured in a crash
Motor vehicle accidentsPeople hurt in New York City traffic crashes often have questions about insurance claims, medical bills, and what their options are. Those questions are worth raising with an attorney who handles motor vehicle cases. Silver Law Group is available to talk through what happened.This article is informational and is not legal advice.